
Firebase Crashlytics: Proactive Error Monitoring

Table of Contents
🚨 Theory: The Pyramid of Observability
In DevOps, monitoring is not binary (works/doesn’t work). There are levels:
- Crashes (Fatal): The app closed. Priority 0.
- Non-Fatals (Logical Errors): The app didn’t close, but payment failed or the list didn’t load. Silent and deadly for business.
- ANRs (Application Not Responding): The UI froze for more than 5 seconds. Destroys UX.
Firebase Crashlytics covers all three, but only if you configure it correctly.
🛠️ Advanced Configuration: Beyond the Plugin
Installing the plugin is easy. The hard part is making the reports actionable.
1. Custom Keys: Context is Everything
When you see a NullPointerException crash in UserProfileFragment, you wonder: “What was the user doing?”.
Use Custom Keys to inject state into the report:
FirebaseCrashlytics.getInstance().apply {
    setCustomKey("current_screen", "UserProfile")
    setCustomKey("user_tier", "Premium")
    setCustomKey("device_orientation", "Landscape")
    setCustomKey("has_connectivity", false)
}
Now, in the console, you can filter: “Show me all crashes happening to Premium users without connectivity”.
2. Custom Logs: The Black Box
Sometimes the stacktrace isn’t enough. You need the steps leading up to it (breadcrumbs).
fun logBreadcrumb(message: String) {
    // This is not sent immediately. It's stored in a circular buffer.
    // Only sent IF a crash occurs later.
    FirebaseCrashlytics.getInstance().log(message)
}

// Usage
logBreadcrumb("User clicked Buy Button")
logBreadcrumb("Starting payment transaction")
// CRASH! -> The report will include these logs.
3. Reporting Non-Fatals (Silent Errors)
Use recordException for errors caught in try-catch that are critical to business logic.
try {
    processPayment()
} catch (e: PaymentException) {
    // We don't crash the app, we show a dialog.
    // BUT, we alert Crashlytics.
    FirebaseCrashlytics.getInstance().recordException(e)
    showErrorDialog()
}
🔍 De-obfuscation and ProGuard
If you use R8/ProGuard (and you should), your production stacktraces will look like this:
at a.b.c.d(SourceFile:1)
To see real code, you need to upload the mapping.txt file to Firebase.
The Gradle plugin does this automatically, but in CI/CD it sometimes fails.
CI Tip: Ensure you run the uploadCrashlyticsMappingFileRelease task in your GitHub Actions pipeline after building the release.
📊 BigQuery Integration
Crashlytics gives you pretty dashboards, but limited. For deep analysis, export to BigQuery.
Questions BigQuery can answer:
- “What is the crash rate per specific Android version?”
- “Do users who experience this crash abandon the app forever?”
- “Is this crash correlated with a specific WebView version?”
🛡️ Crash Free Users vs Crash Free Sessions
Understand the metric:
- Crash Free Users (99%): 1% of your users had a crash. If you have 1M users, 10,000 people had a bad experience.
- Crash Free Sessions (99.9%): Looks better, but can be misleading if one user has a crash loop on startup.
Goal: Aim for >99.9% Crash Free Users for stable apps.
🎯 Conclusion
Crashlytics is not just for viewing stacktraces. It is your window into the health of your application in the real world. Configure Custom Keys and Logs today; the next hard-to-reproduce bug will thank you.
You might also be interested in
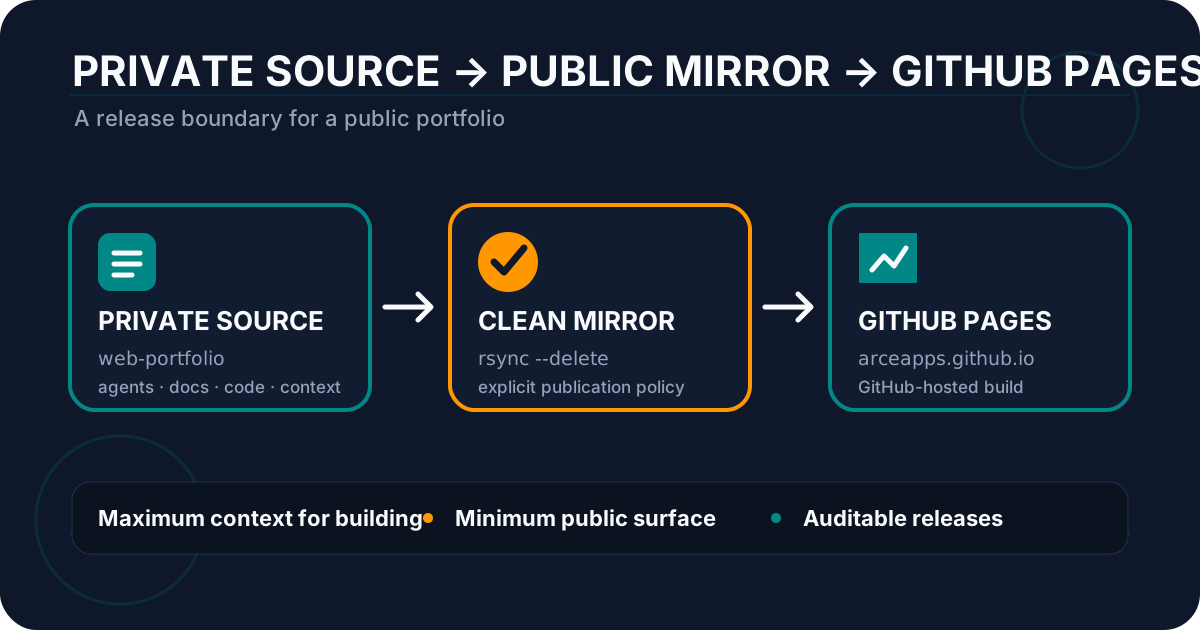
GitHub Pages: Private Portfolio, Public Mirror
Configure GitHub Pages with a private repository, a public mirror, and GitHub Actions to publish a portfolio without exposing internal files.
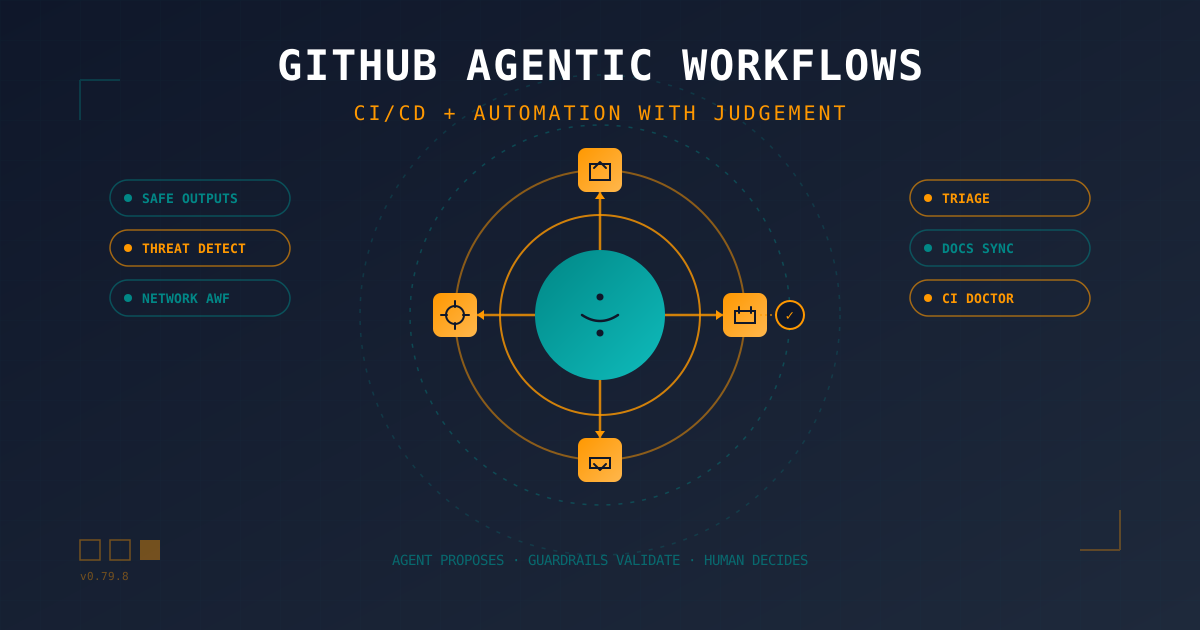
GitHub Agentic Workflows: Automation With ...
CI/CD already automates builds and deploys, but we still spend hours on triage, CI failures, and stale documentation. GitHub Agentic Workflows pushes automation one step further: agents operating inside defined guardrails to handle that repetitive work with judgement.

Claude 4.6 (Sonnet and Opus)
Review of Anthropic's Claude 4.6 family. How 'Adaptive Thinking' and 'Computer Use v2' change the game for mobile CI/CD. Includes comparison with Gemini 3.0 Pro.