
OpenTelemetry GenAI: make agent behavior observable
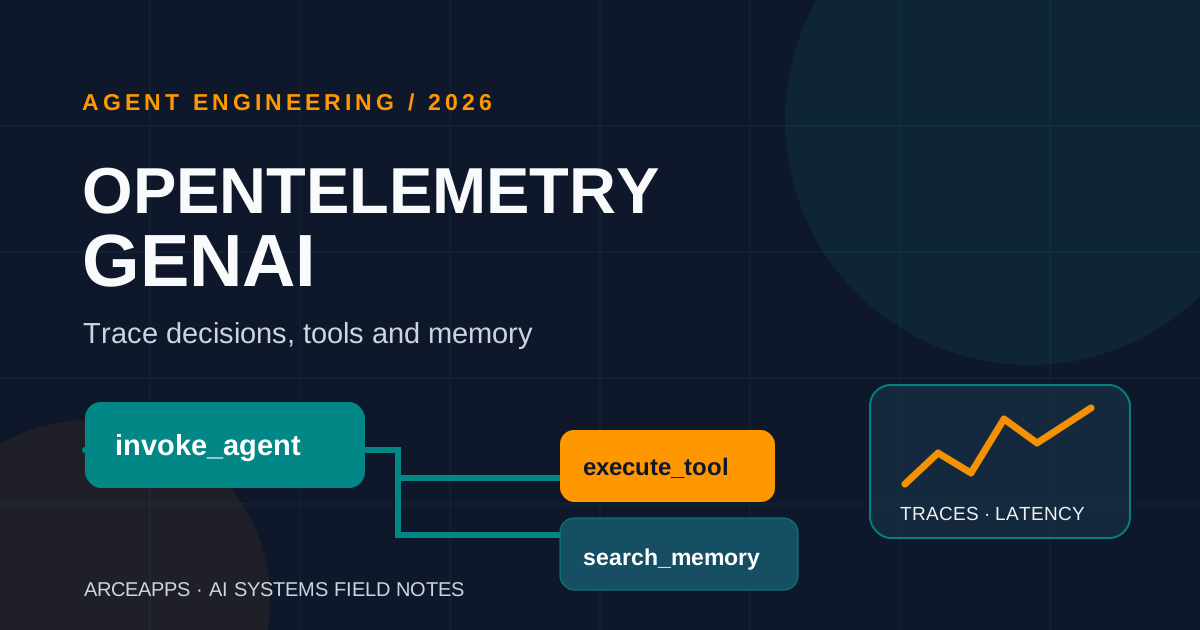
Table of Contents
An agent can say “done” after failing four times
You ask an AI agent to change a piece of code. A few seconds later it replies that the work is done. What the answer does not reveal is that it may have called the same tool repeatedly, retrieved conflicting memories, exhausted a provider quota, retried a request, and finally followed a fallback route. The end result might even be acceptable. But the moment it becomes slow or unreliable, a final chat message is a poor debugging instrument.
For my own software projects, the interesting question is not whether a dashboard looks impressive. It is much more precise: which operation explains the behavior I can observe? If an agent failed to finish, where did its execution diverge? If token usage climbed, was the cause more context, extra model calls, or a retry loop? If an outdated memory changed a design choice, which retrieval made that memory available?
Distributed software learned long ago that scattered logs are insufficient for answering such questions. OpenTelemetry provides common concepts for traces, metrics, logs, propagation, and context. Its Generative AI semantic conventions extend that vocabulary to model inference, tool execution, agent and workflow invocation, and memory operations. The potential value is not a prettier screenshot. It is being able to correlate evidence across components that were developed independently.
One qualification matters from the start. The relevant GenAI conventions still carry a Development status in parts of the official documentation in October 2026. They are not an immutable contract that can be installed once and forgotten. A useful implementation should record the instrumentation versions it depends on and accommodate migrations.
This article builds on my earlier discussions of Codex Agent Router, harness engineering, and long-running agents. The focus here is different: rather than designing an agent’s behavior, we will design the evidence that lets us understand it.
Traces, spans, metrics and logs do different jobs
An agent execution is not one language-model request. There may be a planning step, context retrieval, a search through long-term memories, several model calls, a local test command, a validation step, and persistence of the result. These operations have boundaries and dependencies. Treating all of them as one black box removes the information we most need when something breaks.
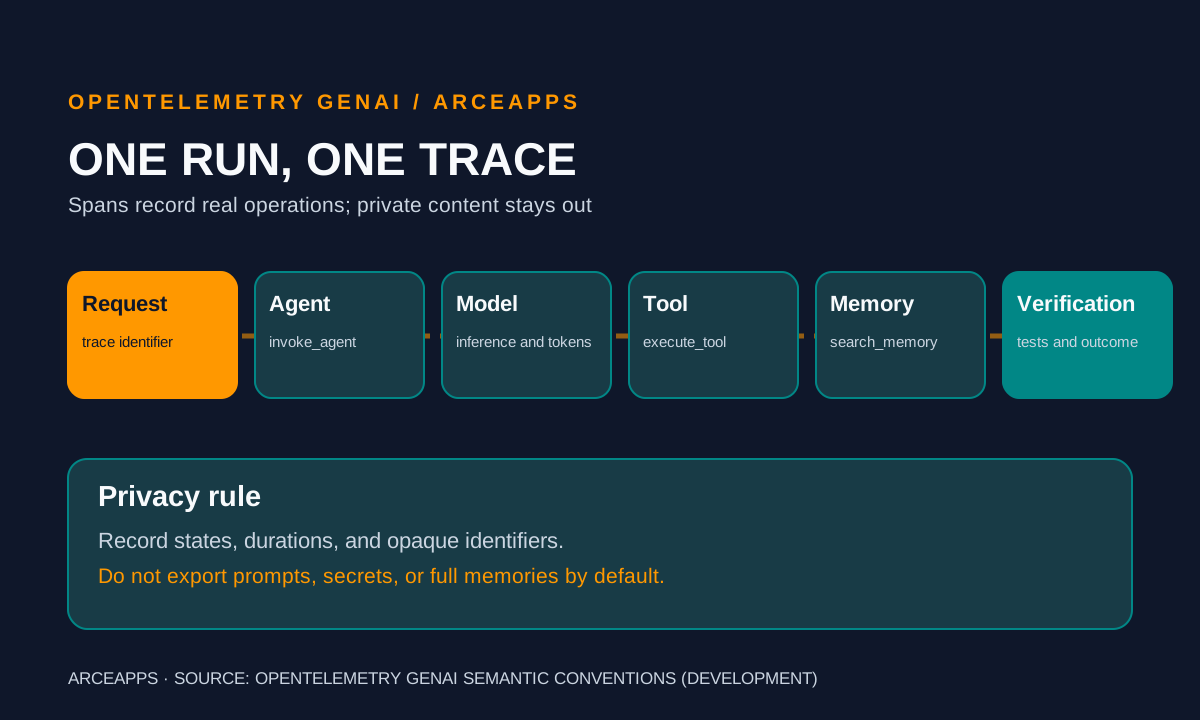
A trace follows a particular execution through those boundaries. A span is one timed operation within that trace. Spans can have parents, children, attributes, events, status, and propagation context. A request span might contain an agent span, which contains a memory search, a model call, a tool execution, and a second model call. That relationship turns a timeline into a useful explanation of work performed.
Metrics summarize behavior across executions: durations, provider-reported token usage, error frequency, or retry rates. Logs capture individual events and diagnostics. All three can be useful, but they are not interchangeable. A latency percentile can tell you that something is slow; it cannot tell you which tool caused one particular failure. An exception log can identify an error; without a trace identifier it may be difficult to connect it to the preceding model call.
AI makes those distinctions more important. Two model requests with the same model name can have very different token budgets, cache behavior, streaming characteristics, and billing. Some providers expose details that others do not. The first principle is to preserve a boundary between reported measurements, derived calculations, and estimates. If a model does not report an input-token category, inventing a value for a convenient chart is not instrumentation.
Draw the execution tree before choosing a backend
Consider a developer asking an agent to fix a failing test. The application receives the instruction and starts a workflow. A coding agent reads the repository, asks its memory store about previous decisions, calls an LLM, invokes a tool to run tests, reads the result, and makes another model call. The final answer is only the last leaf on that tree.
OpenTelemetry’s GenAI vocabulary includes operation names such as invoke_agent, invoke_workflow, execute_tool and search_memory. Those labels are useful precisely because they describe what happened, rather than how a particular product markets itself. They also make comparison across providers easier, provided the emitting instrumentation follows compatible versions of the conventions.
Do not assume that every integration emits all those spans automatically. A model-client wrapper may only know about HTTP requests and model inference. A framework adapter may understand agent and tool calls. Your own code may be the only component that knows when a validation succeeded or a memory record was rejected by an access policy.
That is why I would sketch the tree first, then decide which spans can be emitted reliably by a library and which require a small amount of explicit code. A smaller accurate trace is much more valuable than a larger one that claims actions never occurred.
For example, a model suggesting “run the tests” is not the same event as a test tool actually executing. If the harness rejects a command as unsafe, the trace should preserve that rejection; it should not show the tool as successful. Likewise, a deterministic sequence of data transformations is a workflow, not automatically a deliberative agent. Using precise labels makes diagnosis easier later.
A minimal Python example, with deliberate limits
The following code illustrates the shape of trace instrumentation. It is not a benchmark run in an ArceApps environment. It uses the standard OpenTelemetry tracing API, with the GenAI operation attribute and a couple of explicitly application-specific fields. The point is to show boundaries, not to suggest that this alone configures a production exporter.
from opentelemetry import trace
from opentelemetry.trace import Status, StatusCode

tracer = trace.get_tracer("arceapps.agent.example")

def retrieve_context(query: str):
    with tracer.start_as_current_span("search_memory") as span:
        span.set_attribute("gen_ai.operation.name", "search_memory")
        span.set_attribute("app.memory.results", 3)
        # Replace this with a real retrieval. Avoid sensitive data.
        return ["engineering decision A", "reference B"]

def run_agent(question: str):
    with tracer.start_as_current_span("invoke_agent") as span:
        span.set_attribute("gen_ai.operation.name", "invoke_agent")
        try:
            context = retrieve_context(question)
            with tracer.start_as_current_span("execute_tool") as tool_span:
                tool_span.set_attribute("gen_ai.operation.name", "execute_tool")
                tool_span.set_attribute("app.tool.name", "local_validator")
                # Replace this placeholder with a verified tool result.
                validated = bool(context)
            return {"validated": validated}
        except Exception as exc:
            span.record_exception(exc)
            span.set_status(Status(StatusCode.ERROR))
            raise
The example deliberately avoids claiming to measure token usage, provider cost, or agent quality. Those values require additional evidence. It also does not configure a trace processor, export destination, sampling policy, or security controls. A real deployment needs those pieces and, in many cases, an OpenTelemetry Collector that can filter and transform outgoing telemetry.
The example’s app.tool.name is a local attribute. Before standardizing a production schema, check the current official conventions for equivalent fields. Application-specific attributes are perfectly reasonable when they cover something the standard does not, but undocumented local labels should not silently become the foundation of a supposedly portable dashboard.
The important habit is to instrument an actual operation at its boundary. Avoid manufacturing spans to make a narrative look coherent. If an operation is not observed, the truthful answer is that this part of the execution is not yet instrumented.
Automatic instrumentation is a starting point
Libraries that integrate OpenTelemetry with model providers can save substantial effort. The OpenTelemetry Python GenAI instrumentation project and other specialized SDKs build on the normal SDK and support multiple clients or frameworks. For an experiment, turning on one integration can immediately show latency and token fields reported by a provider.
It would be a mistake to conclude that the whole agent is now observable. An inference wrapper does not necessarily know why the agent made the call, whether the next tool produced a valid answer, or whether an output satisfied the product requirements. A provider returning HTTP 200 is not evidence that a generated program compiles.
Framework coverage varies, too. Some packages know how to wrap model calls, some can trace tools and orchestrators, and others expose decorators for application-level spans. The only reliable approach is to inspect the versions installed and the attributes actually emitted. An attractive example from an older release may use a convention that has since changed.
My preferred approach is a hybrid one: automatic instrumentation for network and inference operations, plus a handful of manual spans around domain-specific actions such as local validation, memory retrieval, test execution, or checkpoint writing. Every additional field should have a clear diagnostic purpose.
There is a maintenance cost to instrumentation. Framework upgrades, concurrency changes, or a new tracing library can generate duplicate spans or lose parent context. Having fewer carefully chosen boundaries is often easier to keep correct.
Measure latency as a sequence, not a single number
A user experiences total latency. Engineers need to distinguish the contributing delays. Queue time, network travel, model inference, tool execution, waiting on storage, and output validation are separate mechanisms. A trace tree helps place those delays on a timeline and identify which parts happened sequentially or concurrently.
The time to first useful response can matter more than total completion time for an interactive assistant. In a coding agent, however, the time to an accepted solution may be the more important measure. Both deserve precise definitions. If a client does not expose a trustworthy first-token event, don’t create that metric by guessing from timestamps that represent something else.
Percentiles deserve more attention than averages when investigating slow tails. A small number of very slow memory searches can create a bad experience even when the average looks respectable. Conversely, a model that regularly spends longer producing a verified fix may be more useful than one that answers instantly but forces manual rework.
Instrumentation becomes especially valuable when a request crosses process boundaries. Propagating trace context between an API, an agent worker and a tool executor allows one coherent view of the execution. Without that context, you get disconnected islands of evidence and have to correlate them by hand.
Token usage is not automatically financial cost
A token count can support a cost estimate, but only with the relevant billing model. Input, output, cache reads, cache writes, reasoning categories and provider-specific definitions may be billed differently. Where a category is missing, record it as unavailable. Zero and unknown are not equivalent.
A pricing table changes over time. A cost calculation should therefore record the pricing assumptions and their effective date. Otherwise a historical chart may silently recalculate past requests under new prices, creating the impression of a performance change that never occurred.
For agents, there is a more fundamental question: what is the unit of value? Cost per model call is useful for infrastructure analysis. Cost per agent attempt is better for workflow optimization. Cost per accepted task is closer to what matters when the agent writes software, but requires an independently verified outcome.
This distinction echoes research on harness engineering. A cheaper attempt that fails more often can cost more in total than a more expensive attempt that finishes reliably. Optimizing token usage without observing success rates can reward the wrong behavior.
I would therefore keep separate metrics for provider-reported usage, derived cost estimates, attempts, retries and accepted outcomes. Only combine them when the denominator is explicitly defined.
Memory is a special observability challenge
A memory search can return several apparently relevant records, one of which contains an obsolete technical decision. The agent may then use that record to justify a poor action. A span showing “search_memory, 120 ms” tells us nothing about why that happened.
Useful diagnostic attributes may include opaque record identifiers, version numbers, retrieval scores, and source references, subject to access controls. Those details let us inspect what was retrieved without indiscriminately copying every stored memory into a tracing backend.
There is a crucial line I would not cross by default: logging the complete memory content, user prompt, or tool response as telemetry. Agents often handle private files, credentials, personal preferences and data from multiple contexts. An external observability platform is another destination for that information. Data may be safe in the memory store yet improperly exposed in exported spans.
If two agents share memory, include enough context to verify that the appropriate scope and authorization rules were applied. A perfectly recorded privacy violation is still a violation. Authorization belongs in the retrieval path; observability can only show what happened and help detect mistakes.
This connects to persistent agent memory and cross-agent memory over MCP. Better tracing makes those architectures auditable, but it does not turn untrusted memories into truth.
Make privacy a design constraint, not a late filter
The content flowing through AI systems can be more sensitive than conventional application telemetry. Prompts may include private source code, names, documents, hidden configuration, or chunks of a local filesystem. Tool outputs may reveal credentials and secrets. Even filenames can be sensitive in some contexts.
A defensible policy answers several questions before deployment. Which attributes are permitted? Which are redacted? Who can query a trace? How long is it retained? Is the export destination local or managed by another provider? How are deletion and audit handled?
A naive secret-detection regular expression is not enough. Secrets can have unpredictable formats, and private information is not restricted to tokens that look like API keys. I prefer an allowlist of exportable fields, size limits, and dedicated tests that assert sensitive strings cannot leave the application. A Collector can enforce additional controls, but those controls must be tested rather than assumed.
Development mode is not a justification for copying production prompts into a shared dashboard. When deep inspection is necessary, a short-lived local recording with synthetic or explicitly authorized data is safer than a permanent global setting.
Privacy is also a performance concern. Capturing enormous prompts and responses increases network traffic, storage and processing. Recording less is often both safer and easier to operate.
Sampling and cardinality: how telemetry becomes another problem
A single agent run may contain hundreds of spans. Tool loops, retries, subagents and retrievals can multiply the volume quickly. High-cardinality attributes such as raw query strings, document IDs or arbitrary labels increase storage and indexing costs.
Sampling can reduce data volume, but it introduces selection bias. Keeping only a tiny random fraction may hide exactly the failures you want to study. Error-oriented sampling and representative normal traces can help, depending on what your SDK and collector support. A sampling policy should explain what it retains and what conclusions can no longer be drawn from the resulting dataset.
Retention should also vary by purpose. Aggregated latency metrics may be useful for longer periods. Detailed diagnostic traces should often expire much sooner and have narrower access. There is no universal number of days suitable for every application, so the answer belongs in product requirements rather than in a copied configuration file.
A practical test for every attribute is: can I use this to filter, group, correlate or explain an incident? If not, the field may not justify its cost and risk. Telemetry should be a deliberate instrument, not an unlimited memory dump.
A hypothetical investigation of a slow coding task
Imagine an agent asked to fix one failing unit test. It eventually reports success after twenty seconds. A simple log shows the duration; a trace reveals six seconds retrieving context, eight in model inference, four running tests and two in waiting or serialization.
Now suppose the tests ran three times. Were the repeated calls intended, triggered by genuine errors, or caused by a coordination loop? Spans can show which model response preceded each command, what status it returned and whether a later action depended on the result.
I would investigate using a representative set of tasks, anonymous identifiers, fixed model and harness versions, test outcomes, and token budgets. I would compare similar task classes, calculate distributions rather than a single average, and inspect some failing trajectories before proposing an optimization.
This is an illustrative investigation, not a result measured on the ArceApps portfolio. The distinction matters. Generated charts can look authoritative even when their underlying numbers were guessed. A reproducible protocol is more valuable than a dramatic but unverifiable headline.
One useful extension is to connect the trace identifier to a test artifact or repository commit. Then an execution can be inspected alongside the code and the verification it produced. That link creates a stronger audit trail without requiring a full transcript in the telemetry system.
Common mistakes that good tracing can expose
The first mistake is equating an HTTP success with a completed task. The second is blaming the model for following a misleading tool description. The third is attributing a delay to inference when memory storage was blocked. The fourth is treating intentional repeated validation as an accidental infinite loop.
Traces can help separate these cases, but they do not establish causality on their own. A span tree is the perspective of instrumented components. Work performed outside those boundaries is absent, not necessarily nonexistent.
Instrumentation itself can fail. An exception may leave an incorrectly closed span, asynchronous execution may lose context, hosts may have clock skew, or two integrations may emit duplicate model spans. Before diagnosing an agent regression, verify that the measurement system behaves correctly.
A simple controlled test can inject three known cases: a timeout, a tool rejection and an invalid model response. Verify that the emitted spans distinguish all three. If the backend cannot tell them apart, the dashboard is not yet reliable evidence.
This is one reason I resist dashboards with an unexplained “agent intelligence score”. A composite number created from unrelated telemetry rarely reflects software correctness.
Choosing tools without overbuilding a personal project
A solo developer does not need an enterprise-scale observability stack on day one. The SDK, a development exporter and a local span viewer may be enough to prove the design. When there is a need for persistent traces or cross-process correlation, a Collector and a backend can be introduced deliberately.
Jaeger, Grafana Tempo, OpenSearch and specialized platforms provide different experiences and operational costs. Some focus on distributed traces, others integrate metrics or offer AI-specific views. Choose based on the data actually emitted, query requirements, storage and deployment constraints, not on a polished screenshot.
Tools such as Logfire can make application-level instrumentation more convenient, particularly in Python environments. That does not remove the need to review what is captured automatically and where it goes. Convenience is a feature, not a privacy policy.
The question I would use to evaluate any solution is practical: can I follow a run from user request to tool execution and final validation, understand its costs, and demonstrate that private content was not exported?
If the answer is yes with a small local setup, keep it small. An elaborate infrastructure that creates more maintenance than insight is not a success.
Tests, CI and evidence of a successful agent run
Observability is not a substitute for tests or a specification. A trace can faithfully record a broken execution; without an independent success criterion, it cannot say whether the behavior was correct.
I would add instrumentation contract tests using synthetic runs. One test checks parent-child relationships. Another verifies errors and retries. A third confirms that a forbidden secret string never reaches an exporter. A fourth tests how the application behaves when telemetry storage is unavailable: the agent should not fail its primary task merely because a monitoring destination has problems.
Then connect production or local-run metrics to outcomes that have meaning: passing builds, regression tests, security checks and accepted functional results. Those labels need reliable provenance. A green icon emitted by the agent itself is not a replacement for verification.
Metrics can reveal trends outside CI: rising retry rates, degraded retrieval latency, unexpectedly high tokens per accepted task or an increasing fraction of incomplete runs. But compare equivalent workloads. A week with more complex tasks can change averages without indicating a product regression.
The combination I want is simple: CI proves what can be checked deterministically; traces help explain what happened when real executions departed from the expected path.
Evolving GenAI conventions require maintenance
In October 2026, the official OpenTelemetry GenAI documentation marks parts of its semantic conventions as Development. That status should influence design. Pin compatible library versions, inspect actual attributes, keep migration notes and avoid treating experimental fields as the sole source of critical business data.
Different packages may implement a different subset of the evolving conventions. A model-client wrapper is not automatically a complete agent instrumentor. An example copied from a tutorial may no longer match your exact version. The safest source is the documentation and code of the versions you deploy.
Standardization is valuable when it lets us connect traces from different providers without building bespoke adapters forever. But no naming convention can decide whether a task is truly solved, whether a memory is trustworthy or whether a user authorized a data disclosure.
Those are architectural and product responsibilities. The observability layer should expose evidence for answering them, not claim to replace judgment.
The smallest useful tracing policy I would adopt
I would start with five boundaries: run entry, model call, tool execution, memory search and final validation. For each, record duration, status and minimal opaque identifiers. Preserve provider-reported token usage when available, with clear missing values where it is not.
I would leave out the model’s hidden reasoning, indiscriminate copies of prompts, environment secrets and private document content. I would also avoid composite scores that pretend latency, cost and quality are interchangeable.
When a concrete incident requires more detail, temporarily expand instrumentation under a documented privacy rule, reproduce the problem, fix the root cause and then reduce data volume again. Observability needs to be able to shrink as well as grow.
Most importantly, I would resist the temptation to optimize an agent for looking good in a dashboard. The goal is completed, verified work. Metrics and traces exist to make that work explainable, not to reward activity for its own sake.
Lessons learned and conclusion
My main takeaway is that an observable agent is not one whose entire conversation has been archived. It is one whose real operations can be followed, whose outcomes can be checked, and whose data boundaries are understood. That distinction becomes essential once an agent uses tools, persistence, memory and multiple providers.
OpenTelemetry GenAI offers a promising shared vocabulary. It also comes with caveats: evolving conventions, incomplete integration coverage, and serious privacy responsibilities. For a small indie project, the right investment is a few trustworthy spans before an elaborate monitoring platform.
The promise of agents is not to generate more traces, more tokens or more activity. It is to complete useful work. Good observability helps us find out when they actually do.
References and related reading
- OpenTelemetry GenAI span semantic conventions, official development-status specification.
- OpenTelemetry conventions for agents and workflows, operation names and attributes.
- OpenTelemetry Python GenAI instrumentation, official repository.
- OpenTelemetry concepts: traces, introductory reference.
- OpenSearch: instrumenting AI agents, complementary example.
- On ArceApps: Codex Agent Router, harness engineering, and agent memory.
You might also be interested in

Hipocampus
A technical deep-dive into Hipocampus, a drop-in memory harness for AI agents that uses a 3-tier Hot/Warm/Cold architecture and a 5-level compaction tree. How ROOT.md enables constant-cost memory awareness and how it compares to hmem, Mem0, and Letta.

hmem: Hierarchical SQLite Memory for AI Ag...
A technical deep-dive into hmem (Humanlike Memory), an MCP server that models human memory in five lazy-loaded levels backed by SQLite + FTS5. How Fibonacci decay, logarithmic aging, and a curator agent solve the context window problem across sessions and machines.

PlugMem: Microsoft Research's Task-Agnosti...
A technical deep-dive into PlugMem, Microsoft Research's plugin memory system that transforms raw LLM agent interactions into reusable structured knowledge. How its three-component architecture (Structure, Retrieval, and Reasoning) outperforms task-specific memory designs.